The trees in my neighbourhood
Module 2 - My tree can multi-task
Download the module 2 [PDF 722 MB]
Summary of module 2
Students discover the role of trees in relation to their environment. First, students become aware of the beneficial effects of trees on our quality of life, through a small urban planning project. They then fill out a questionnaire, and ask their acquaintances to complete it as well, as a homework assignment. With the help of a series of measurements and observations made outside in the schoolyard or along the street, as well as in a park or wooded area, students use the results of their observations and the questionnaire to reach the correct conclusions.
Cross-curricular competencies
- CCC1 - Use information
- CCC5 â Adopt efficient work methods
- CCC9 - Communicate appropriately
Subject area competencies
- SAC1 - Seek answers or solutions to scientific or technological problems: define a problem, choose an investigation or design scenario, carry out the procedure, conduct an experiment, analyze the results or solution
- SAC2 - Make the most of knowledge of science and technology: understand how technical objects work, understand natural phenomena
- SAC3 - Communicate in the languages used in science and technology: participate in exchanging scientific and technological information, divulge scientific or technological knowledge or results, interpret and produce scientific and technological messages
Objectives
- Understand the positive impact of trees on the environment
- Know how to use measuring instruments
- Learn to observe the tree environment and ecosystem
Contents
- Diversity of life: physical and behavioral adaptation
- Life-sustaining processes: input and output (energy, nutrients, waste)
Classroom organization
- Suggested timing: spring or early fall
- In teams of 4 or 5, as a group or individually
- Duration: one class period of 60 minutes + 30-minute homework assignment, one outdoor period of 120 minutes and one class period of 60 to 75 minutes + 15-minute homework assignment
Sequence of activities for Module 2
- Activity 1: A tree in my yard - 60 minutes â in class + 30-minute homework assignment
Students complete an urban design plan by adding trees. They justify their choices during a discussion session, examining the advantages and disadvantages of trees in an urban environment. They draw conclusions regarding the beneficial effects of trees on quality of life. Subsequently, they complete a questionnaire that they administer to their circle of acquaintances as a homework assignment. The results of this questionnaire will be used in Activity 3.
 - Activity 2: A tree to measure - 120 minutes â outdoors (schoolyard and woods)
Students take a series of measurements and note observations made around trees in the schoolyard or along the street near the school, and in a park or woods. They learn to estimate the height of a tree, measure its circumference, take temperature readings, observe biodiversity, etc. The results will be used in Activity 3.
 - Activity 3: Happiness... under a tree! - 60 to 75 minutes in class + 15-minute homework assignment
Students use the observations and data collected in Activities 1 and 2. They calculate the average diameter and height of trees. By comparing the results obtained at the two locations studied, they realize the impact of trees on different environmental factors. As a homework assignment, they evaluate total biomass, and then the quantity of carbon stored in a tree.
Â
Activity 1 - A tree in my yard
Teacher Activity
Summary
Students complete an urban design plan by adding trees. They justify their choices during a discussion session, examining the advantages and disadvantages of trees in an urban environment. They draw conclusions regarding the beneficial effects of trees on quality of life. Subsequently, they complete a questionnaire that they administer to their circle of acquaintances as a homework assignment. The results of this questionnaire will be used in Activity 3.
Classroom organization
60 minutes â in class â as a group, in teams of 4 or 5 and individually
30 minutes â homework assignment
Material required
| Worksheet title | Contents | Quantity/User |
|---|---|---|
| Concepts | The urban forest | 1 teacher |
| Answer key 1 | Answers to Experiment 1 worksheet | 1 teacher |
| Answer key 2 | Answers to Experiment 2 worksheet | 1 teacher |
| Experiment 1 | Urban design plan to be completed* | 1 per team |
| Experiment 2 | Questionnaire to fill out and administer as a homework assignment | 3 per student |
- * This plan is available in interactive version in the Games section under the title The Tree in my neighbourhood.
Step-by-step procedures
- Divide the students into teams
- Present the urban design plan to be completed (Experiment 1 worksheet). Explain that urban planners and landscape architects follow precise criteria when planting trees in cities.
 - Ask students to complete the urban design plan (Experiment 1 worksheet) by discussing with their team what criteria justify the choices of planting site and genus of tree to be planted there.
 - Assess the progress of each team and ask teams to justify their choices.
 - Present an ideal design (Answer key to Experiment 1 worksheet) and provide a more detailed explanation of the choices an urban planner would make.
 - Have the students fill out the questionnaire (Experiment 2 worksheet) in order to find out whether they appreciate trees and for what reasons.
 - Ask the students to administer the questionnaire (Experiment 2 worksheet) to their circle of acquaintances as a homework assignment, and to bring the answers to the next session (for Activity 3).
Note for teachers
This activity is available for 4 different landscapes in an online interactive format in the following section of the Trees Inside Out virtual exhibit: Branching Out > Games > The Trees in my neighbourhood.

Activity 2 - A tree to measure
Teacher Activity
Summary
Students take a series of measurements and note observations made around trees in the schoolyard or along the street near the school, and in a park or woods. They learn to estimate the height of a tree, measure its circumference, take temperature readings, observe biodiversity, etc. The results will be used in Activity 3.
Classroom organization
120 minutes outdoors (location 1: the schoolyard or street - location 2: a park or woods close to the school) â the entire class and in teams of 4 or 5 students. The duration may vary according to the distance between the two locations used for observation.
Material required
1 thermometer per team
1 measuring tape per team
1 sheet of graph paper per team
Colored ribbon to allow identification of the trees (one color per team)
| Worksheet title | Contents | Quantity/User |
|---|---|---|
| Concepts | The urban forest | 1 teacher |
| Tool | Identification key (module 1) |
1 teacher and 1 per team |
| Experiment 3 | Inventory and observations to be assembled during the experiment | 8 per team |
Preparation
30 minutes
Identify eight trees per team using the colored ribbon (1 color per team): four in the schoolyard or along the street near the school, and four in a park or woods.
Step-by-step procedures
- Divide the students into teams
  Location 1: the schoolyard or street
  == On the site, distribute 8 copies of the Experiment 3 worksheet and the identification key (Tool worksheet) to each team..
  == Review how to use the identification key (see Module 1 â Activity 3).
  == Define the boundaries of the zone that each team will explore.
  == Help students to fill out the Experiment 3 worksheet by teaching them the methods for estimating the height and circumference of the tree (see the Experiment 3 worksheet)
  Location 2: park or woods
  == Define the boundaries of the zone that each team will explore.
  == Complete the rest of the Experiment 3 worksheet.
 - Back in class, summarize:
  == Location 1 did not resemble Location 2, and, at first glance, the measurements taken seem different too.
 - Start a debate on the differences between the two habitats, and encourage students to formulate hypotheses.
 - Suggest that students analyze results in class during the next session. Collect the Experiment 3 worksheets, and ask students to bring back the questionnaires completed at home after Activity 1.
Activity 3 - Happiness... under a tree!
Teacher Activity
Summary
Students use the observations and data collected in Activities 1 and 2. They calculate the average diameter of trees, and then evaluate the quantity of carbon stored.
By comparing the results obtained at the two locations studied, they realize the impact of trees on different environmental factors.
Classroom organization
60 to 75 minutes in class â in teams of 4 or 5 students + 15-minute homework assignment
Material required
1 calculator per student
1 computer with internet access (at school or at home)
| Worksheet title | Contents | Quantity/User |
|---|---|---|
| Concepts | The urban forest | 1 teacher |
| Answer key 4 | Answers to Experiment 4 worksheet | 1 teacher |
| Experiment 2 | Questionnaires completed as a homework assignment in Activity 1 | Filled out by each student |
| Experiment 3 | Inventory and observations already assembled for the experiment | Filled out by each student |
| Experiment 4 | Use the data from the questionnaire and the experiment | 1 per student |
Step-by-step procedures
- Summarize what was accomplished during Activity 2 outdoors.
 - Explain that, ideally, different tree species are selected for plantation along streets, first for aesthetic reasons (variety of colors and gradual leaf fall in autumn) but also to limit the impact on the landscape if a disease were to decimate the trees of a particular species. A diversified landscape also increases the species of wildlife present on the street.
 - Explain that certain trees are younger than others because they have replaced trees that were cut down or that fell during storms. These younger trees do not yet provide all the same services the older ones are able to. Among fully-grown trees, some have developed better than others. Not all trees have the same appearance. For example, some have a damaged crown or are crooked. Conditions such as light intensity, space to grow and weather since plantation can explain such differences.
 - Explain that the average size of the leaves of a tree reflects its evapotranspiration rate. To limit this phenomenon when sunshine, temperature or wind could cause the leaf to dry out, the tree reduces its evapotranspiration. One adaptive strategy involves producing smaller leaves. However, the tree also has other strategies: closing stomata, allowing leaves to fallâ¦
 - Review students' knowledge of photosynthesis.
 - Break the class up into teams again, and ask them to fill out the Experiment 4 worksheet. To get started, redistribute the completed Experiment 3 worksheets to the teams. Ask students to take out their completed questionnaires (Experiment 2 worksheet).
 - Review the points in questions 11 and 12 of the Experiment 4 worksheet as a conclusion: the influence trees have on different environmental components.
 - As a homework assignment (or in class) ask students to answer questions 13 and 14 of the Experiment 4 worksheet and to bring their answers to the next session. Then assess their answers and summarize the role of trees as a carbon sink.
Teacher Concepts
The urban forest
The urban forest comprises all the trees of a city, those in green spaces, on vacant lots and on private property.
Although the urban forest only represents a tiny percentage of Canada's forest cover, it nonetheless plays a very important environmental role, since almost 80% of the population lives in urban areas.
Trees make a great contribution to our environment, and most cities have adopted strategic plans to protect them and establish their value.
The territory of the city of Montreal, excluding the municipalities that demerged in 2006, includes about 675,000 public trees (trees along the street, on city-owned wooded land and in parks â excluding nature parks), valued at about $700 million.
What services can trees provide to the community?
- Trees provide oxygen through photosynthesis. According to Tree Canada, a mature tree can provide the daily oxygen requirements for four individuals.
- Trees also help to clean the air. They can absorb up to 7,000 dust particles per litre of air.
- Photosynthesis enables trees to act as a carbon sink, and helps combat global warming. An adult tree sequesters an average 2.5 kg of carbon per year. It takes about 500 trees to compensate for the CO2 emissions of a single car driven 20,000 km per year.
- By providing shade and releasing water through evapotranspiration, trees help cool the atmosphere and counter the effect of urban heat islands. On average, a tree-lined street will be 3 to 5 °C cooler in the summertime.
- Electricity consumption in a house shaded by trees is 10 to 15% less than that of a house exposed to the sun.
- Trees also help absorb noise.
- Trees provide food and shelter to many animals, increasing biodiversity by their very presence.
- Trees retain groundwater and impede erosion. During a storm, they can act as holding tanks, thereby diminishing the risk of flooding.
- Trees are also part of our collective heritage and memory. And, they have a positive impact on our psychological well-being.
Student Experiment 1
Introduction
Urban planners, landscape architects and horticulturists select trees for planting in an urban metropolis according to certain criteria.
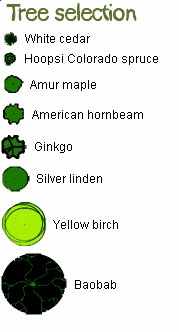
Discover these criteria by first creating your own landscape design. Choose trees in the menu located below the landscaping plan and copy them onto the plan using the letter that identifies them.
The Schoolyard
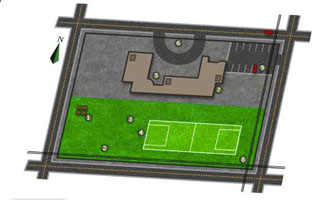 Hurrah for the trees in the schoolyard!
A true source of creativity and inspiration, their shadows are nice, they offer meeting points, divide the play areas, contribute to the identity of the school and to the well-being of all those who attend the school.
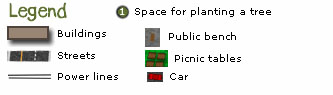
| School yard (Space #) |
Specifications |
|---|---|
| 1 | 4 m from the school building |
| 2 | 6 m from the power line, in the parking lot |
| 3 | 2 m of 2 walls of the building |
| 4 | Grassed area |
| 5 | Sidewalk line in the entrance way |
| 6 | 3 m from picnic tables, 4 m from # 9 |
| 7 | Along the soccer field, 10 m from # 8 |
| 8 | 10 m from # 7 |
| 9 | 3 m from picnic tables, 4 m from # 6 |
| 10 | Under 2 power lines |
Â
| Species | Description | Landscaping appeal & problems |
|---|---|---|
|
White cedar Thuja occidentalis |
Height: 12 m Width: 4 m Sun or partial shade Spacing: 4 m |
Landscaping appeal: Stays green year round. |
|
Hoopsi Colorado spruce Picea pungens 'Hoopsii' |
Height: 6 m Width: 4 m Sun Spacing: 4 m |
Landscaping appeal: Silvery-blue needles, reddish-purple cones in spring. |
|
Amur maple Acer tataricum |
Height: 6 m Width: 6 m Sun or partial shade Spacing: no restrictions |
Landscaping appeal: Leaves dark green on top and pale green underneath, yellow to bright red in autumn. Persistent fruits in autumn. |
|
American hornbeam Carpinus caroliniana |
Height: 8 m Width: 7 m Sun, partial shade or shade Spacing: 4 m |
Landscaping appeal: Yellow, orange and scarlet red foliage in autumn. Care: poor tolerance to deicing salts and soil compacting. |
|
Gingko Gingko biloba |
Height: 20 m Width: 8 m Sun or partial shade Spacing: 7.5 m |
Landscaping appeal: Leaves unique to its genus, golden-yellow in autumn. Disease free. Care: Be sure to plant a male specimen, as females bear smelly fruits. |
|
Silver linden Tilia tomentosa |
Height: 15 m Width: 9 m Sun or partial shade Spacing: 7.5 m |
Landscaping appeal: Highly scented flowers (honey-scented) in summer. Appreciated for the shade it provides. Care: May host aphids producing honeydew. |
|
Yellow birch Betula alleghaniensis |
Height: 20 m Width: 15 m Sun or partial shade Spacing: 12.5 m |
Landscaping appeal: Tree emblem of Quebec. Golden bark, yellow leaves in autumn. |
|
Baobab Adansonia digitata |
Height: 20 m Width: 22.5 m Sun Spacing: 25 m Origin: Africa |
Landscaping appeal: Very large scented flowers. Care: Needs a warm environment. |
Student Experiment 2
Questionnaire
a. How would you describe your street?
b. What do you like about your street?
c. What don't you like about your street?
d. What improvements would you like to make to your street?
e. Are there trees in front of your house? If yes, for how long do you think they have been there?
f. Do you appreciate having trees on your street?
g. What advantages are there to having trees?
h. What are the disadvantages of having trees?
i. Would you like to have more trees on your street?
j. Would you like to have a tree or more trees in front of your house?
Student Experiment 3
Inventory and observation worksheet
Introduction
A tree is a living being that breathes, absorbs water and manufactures its own food through photosynthesis. Its lifestyle, like ours, develops in relation to the environment.
Environmental factors influence tree growth, which in turn has an impact on these environmental factors. Discover more about these factors through this activity.
Date of observation:
Location of observation:
1. Identify the genus of the tree using the identification key provided (Tool worksheet).
Genus:
2. Estimate the number of trees of the same genus present at the observation site:
3. Estimate the height and circumference of the tree trunk.
Method:
To estimate the height of a tree, imagine a building several stories high in your neighborhood. Estimate the height of the tree in stories. Given that on average, a story of a building measures 3m in height, convert the figure to metres by multiplying it by three.
To measure the circumference of a tree, take a tape measure and pass it around the trunk at 1.5 metres above the ground. Read the measurement in cm.
The tree measures approximately_______ metres in height, and possesses a trunk of ________ cm in circumference.
4. Describe the appearance of the tree (size, foliage density, crown shape, bark):
5. Note useful information such as presence of wounds, fruits or flowers:
6. Describe the characteristics of the habitat around the tree (sidewalk, courtyard, nearby electric wires):
7. Describe the biodiversity of the habitat around the tree.
Method:
Count the number of animal species (mammals, insects, birds, reptiles and spiders), plants and fungi that are visible within 5 m around the tree. Watch for signs of their presence: noise, droppings, prints.
Number of different animal species:
Number of different plant and fungi species:
8. Measure the temperature in the shade of the tree and in the sun, using a thermometer.
Method:
To measure the temperature, hold the thermometer still for one minute in the shade of the tree, then note the result.
Then, repeat the same operation several metres from the tree, in the sun. Be sure to stand still with your back to the sun, and keep the thermometer in front of you.
Temperature in the shade of the tree: ____°C
Temperature in the sun, near the tree: ____°C
9. Using a sheet of transparent graph paper, estimate the average surface of a leaf.
Method:
- Place the sheet of transparent graph paper on a leaf you can reach (without pulling it off), or use a leaf that has fallen on the ground.
- To find out the surface in cm2, count the number of squares the leaf covers.
The average surface of a leaf is ____ cm2.
Experiment 4
Introduction
During an outdoor activity, you completed inventory and observation worksheets (Experiment 3 worksheet) for eight trees in two separate locations. You also administered a questionnaire to several individuals.
Collect all this information, and answer the following questions.
1. 1. Which trees did you observe? Complete the following chart according to the results noted in question 1 of your Experiment 3 worksheet.
| Â | Tree # | Genus |
|---|---|---|
| Location 1 Schoolyard or street |
1. 2. 3. 4. |
|
| Location 2 Park or woods |
5. 6. 7. 8. |
2. How many different species did you observe in total?
Answer:
3. Why was the decision made to plant different species along the street? Check the answers that seem accurate to you:
a. For aesthetic reasons (color and shape)
b. For gradual leaf fall in the fall
c. To limit water use
d. To limit the impact of diseases that decimate trees
e. To discourage the presence of animals
4. Report the height and circumference of each tree in the chart below, and calculate the average height and diameter.
Method:
- To calculate the diameter, divide the circumference by 3.14.
- To calculate the average height, total the height measurements and divide by the number of trees.
- To calculate the average diameter, total the diameter measurements and divide by the number of trees.
| Â | Tree # | Height (m) | Circumference (cm) | Diameter (cm) |
|---|---|---|---|---|
| Location 1 Schoolyard or street |
1. 2. 3. 4. Average |
|||
| Location 2 Park or woods |
5. 6. 7. 8. Average |
5. Why are the trees not all the same height?
Check the answers that seem accurate to you:
a. They were not all planted at the same time.
b. Some trees replaced fallen trees and are younger.
c. They are not all of the same species.
d. Some trees developed better because they have more space.
e. Some trees developed better because they were better protected from storms.
6. The trees do not all have the same appearance. For example, some have a damaged crown or are crooked. How do you explain these differences?
Check the answers that seem accurate to you:
The differences can be due to:
a. Light conditions
b. Pollinating insects
c. Space to grow
d. Presence of a spring
e. Weather since plantation
7. Compare the biodiversity around the trees by filling in the chart below and using the inventory and observation worksheets from question 7.
| Â | Number of animal species observed | Number of plant and fungi species observed |
|---|---|---|
| Location 1 Schoolyard or street |
||
| Location 2 Park or woods |
   a. In which location do you find the greatest biodiversity? Why?
8. In the charts below, report the temperature readings you noted during the outdoor activity for question 9 of your inventory and observation worksheets (Experiment 3 worksheet).
a. Calculate the average temperature in the shade of a tree and the average temperature in the sun.
|
Location 1 Schoolyard or street |
Tree 1 | Tree 2 | Tree 3 | Tree 4 | Average |
|---|---|---|---|---|---|
| Temperature under tree (°C) |
|||||
|
Temperature in the sun (°C) |
|
Location 2 Park or woods |
Tree 5 | Tree 6 | Tree 7 | Tree 8 | Average |
|---|---|---|---|---|---|
| Temperature under tree (°C) |
|||||
|
Temperature in the sun (°C) |
    b.Is the temperature cooler in the shade of the tree or in the sun? In which location is the average temperature lowest? Can you deduce the role of the tree in this phenomenon?
9. A tree can help clean the air. It can absorb carbon dioxide (CO2) present in the air and store it in its tissues. Through which biological process is this phenomenon â called carbon sequestration by scientists â made possible? In what form is the carbon stored?
10. Review the questionnaires that you had friends and neighbors fill out.
How are trees perceived by citizens?
What advantages and disadvantages do they see to the presence of trees on their street?
11. According to the answers you provided to the preceding questions, indicate the role of trees with regard to each of the following factors:
Quality of life:
Air quality:
Temperature:
Biodiversity:
12. Can you think of other examples of the impact of trees on the environment that were not mentioned in this activity?
As a homework assignment, or in class, if you have Internet access:
13. Estimate the quantity of carbon gas stored in one of the trees you observed (refer to the appropriate worksheet) using the following method:
First you must calculate the total biomass of your tree:
a. Use the following Internet website:
www.cfl.scf.rncan.gc.ca/calculateurs-calculators/biomasse-eng.asp
b. In the scrolling menu, choose the family of the tree you observed (conifer or leafy).
c. Enter its diameter and height, then click on "calculate".
d. Add the biomass of the trunk, bark, branches and leaves of the tree (data provided on the website) to obtain the aboveground biomass.
e. To obtain the biomass of the tree roots, multiply the aboveground biomass by 0.26.
f. Calculate the total biomass:
Total Biomass = Aboveground Biomass + Belowground Biomass
g. Calculate the quantity of carbon your tree contains:
Total Carbon = Total Biomass x 0.46
h. Convert this into equivalent CO2
CO2 Equivalent = Total Carbon / 0.27
14. A car emits approximately 149 g of CO2 per kilometre.
If this car's average annual mileage is 20,000 km, how many of each of your trees would have to be planted to compensate for the CO2 emissions of this car?
